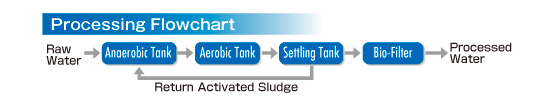
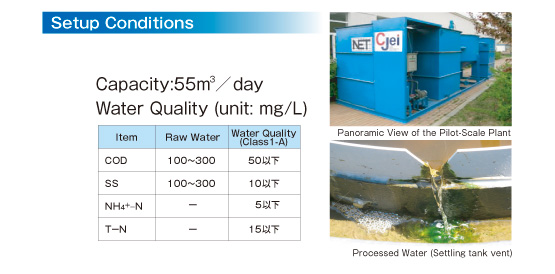
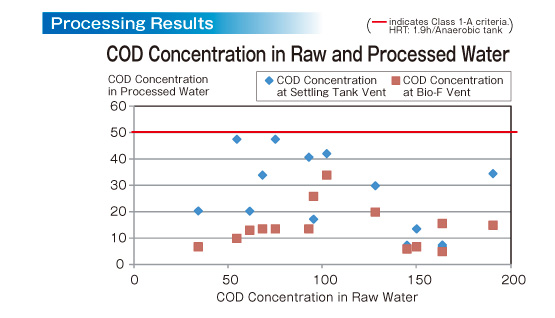
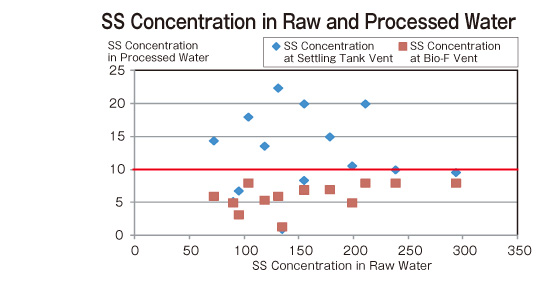
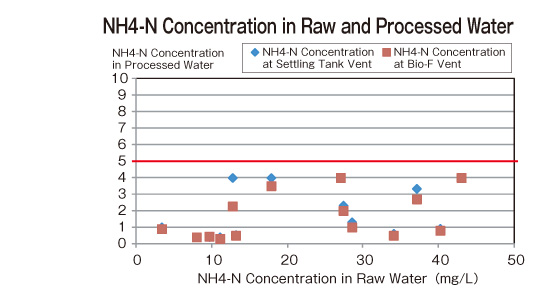
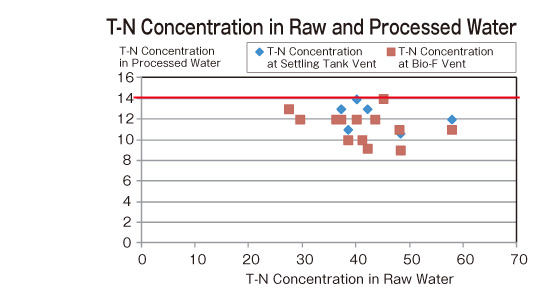
Result of processing with BF-AO method
(advanced water usage)
go to TOP
 Interim Pilot Scale Plant Test Resultstitle.jpg)